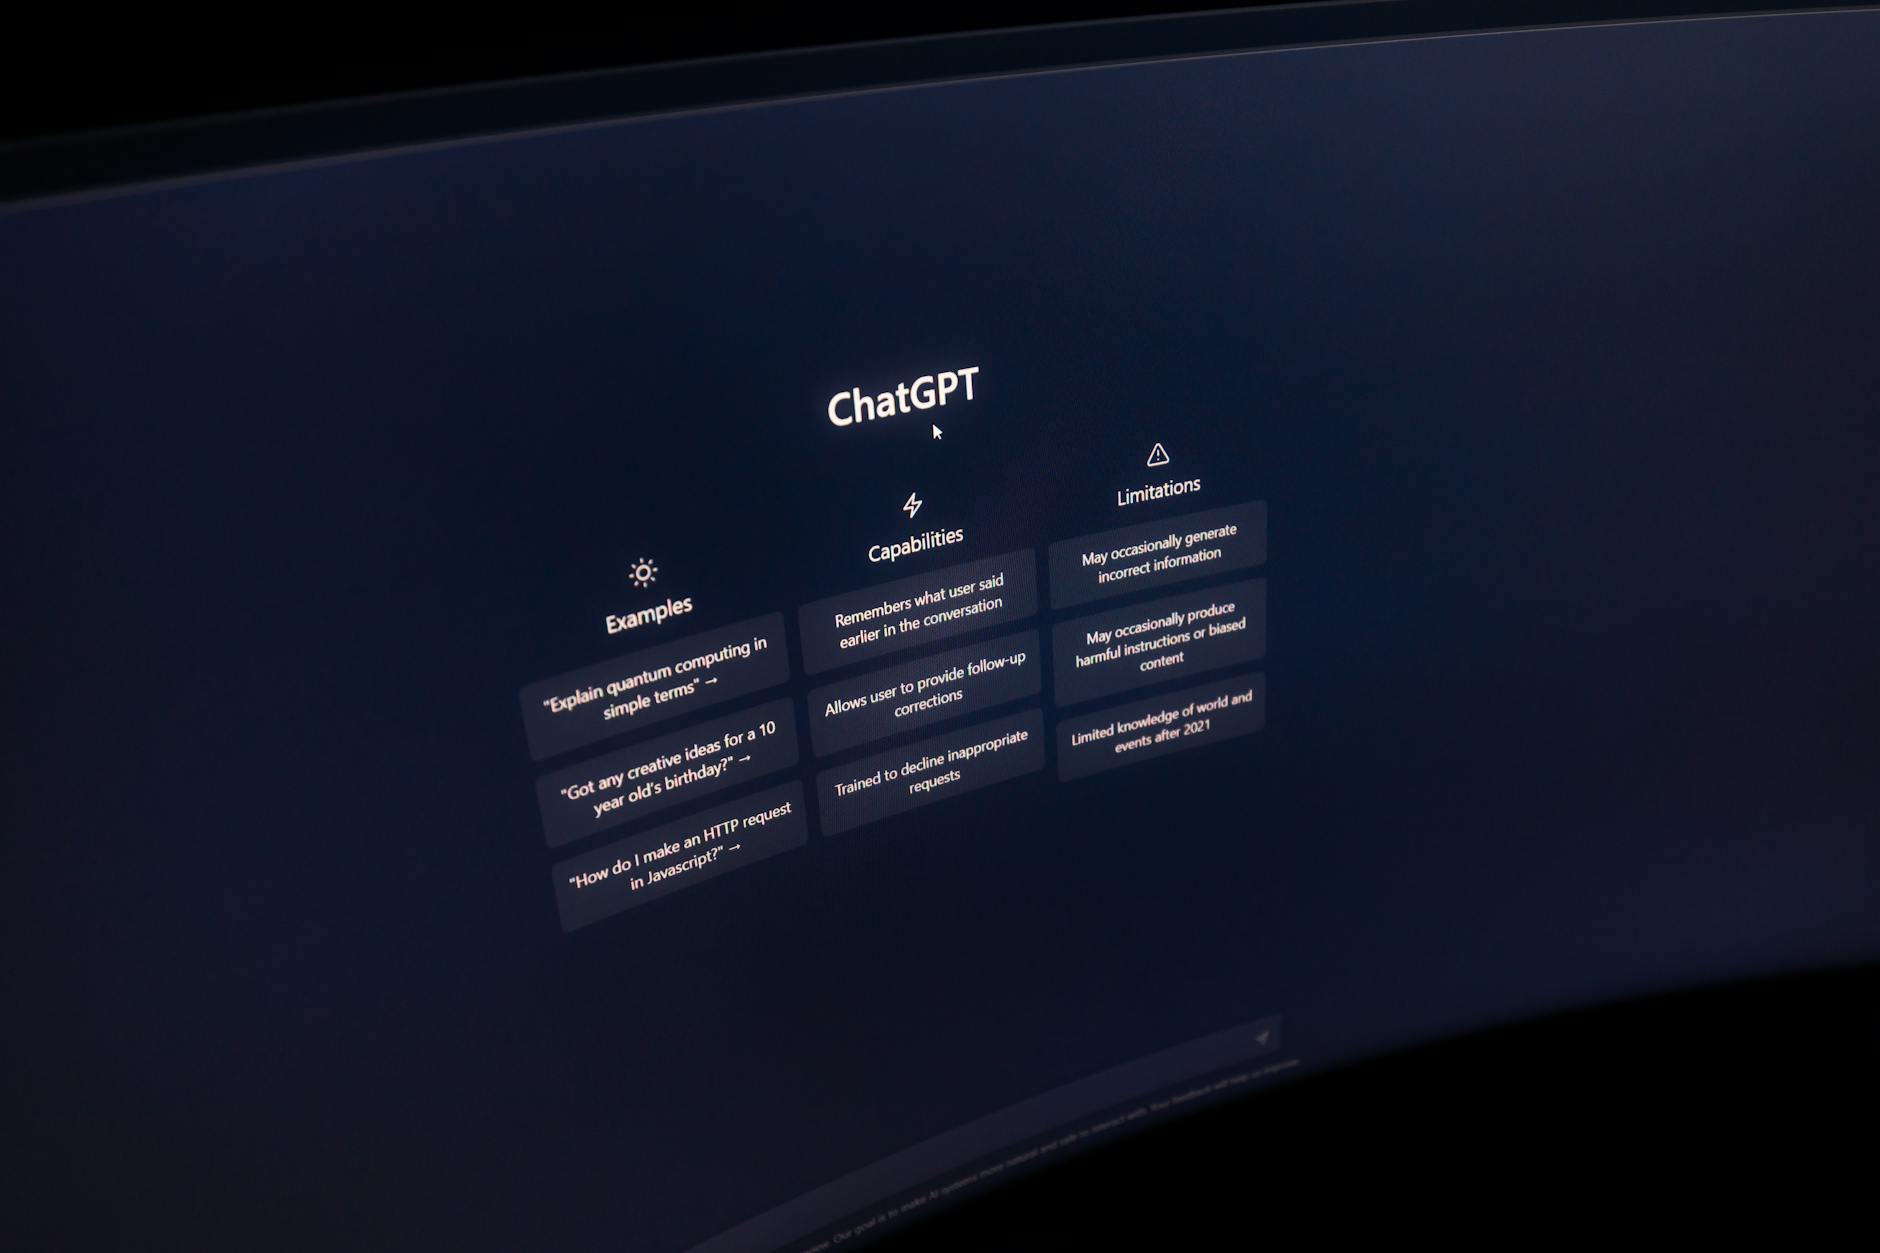
Ai Powered Customer Onboarding Support Chatbot
AI-Powered Customer Onboarding & Support Chatbot
Executive Summary
CodeSmart AI proposes an AI-Powered Customer Onboarding & Support Chatbot—a cloud-native SaaS platform that leverages state-of-the-art NLP and generative AI to automate user onboarding, answer FAQs, and guide procedural tasks in real time. By integrating transformer models (e.g., GPT-4 or Llama 2) deployed on Kubernetes with FastAPI microservices, storing conversational embeddings and retrieval data in Elasticsearch for RAG, and orchestrating event-triggered tasks via AWS Lambda, our solution delivers up to 30 % reduction in support costs, drives self-service adoption, and supports a usage-based pricing model (per-conversation or active-user) for predictable, scalable revenue.
1. Market Landscape
Global Chatbot Market: USD 6.31 billion in 2023 → USD 27.30 billion by 2030 (CAGR 23.3 %)
North America: USD 1.95 billion in 2023 → USD 8.79 billion by 2030 (24 % CAGR)
United States: USD 1.293 billion in 2023 → USD 5.605 billion by 2030 (23.3 % CAGR)
Healthcare Vertical: USD 787.1 million in 2022 → USD 4.356 billion by 2030 (23.9 % CAGR)
2. Market Segmentation
A. Consumers (B2C)
We’ve identified seven high-value segments whose support pain is acute and willingness to pay is demonstrated:
Digital Natives (age 18–35, tech-savvy, high app usage)
Small Business Owners (age 30–60, seeking rapid platform onboarding)
E-learners & Online Students (age 18–45, heavy self-service learners)
Gig-Economy Workers (age 25–50, requiring instant procedural guidance)
Senior Caregivers (age 40–65, moderate tech adoption, need clear step-by-step support)
Remote Employees (global, age 25–55, high reliance on digital HR/IT portals)
Healthcare Patients (age 18–75, accessing telehealth portals—crossover with healthcare chatbot growth)
B. Providers (B2B)
Three core provider cohorts demonstrate high ROI potential:
Large Enterprises (>1 000 employees) with complex multi-system onboarding
Mid-Market SaaS/FinTech Firms (200–1 000 seats) facing support scaling
Digital Health Platforms (telemedicine, wellness apps) requiring 24×7 patient guidance
C. Payors & Platforms (B2B)
Insurance and platform operators can deploy chatbots to reduce call-center load:
National Insurers (e.g., UnitedHealthcare) aiming to deflect 20–30 % of member calls
TPAs & MGAs servicing self-insured employers, seeking lower per-member admin costs
Government Agencies (e.g., Medicare/Medicaid) piloting digital support to improve access
Across all segments, decision drivers include cost efficiency, SLA adherence, user-experience improvements, and integration simplicity with existing CRMs or EHRs.
3. Critical Pain-Point Analysis
We mapped each segment’s journey to identify “painkillers” vs. “vitamins”:
Pain Point Frequency / Severity Emotional Impact Cost Impact Time Burden Current Fix Our Advantage
Long hold times & call-backs Daily High (frustration) Avg. $5–10 per call 5–15 min/wait IVR menus + chat hours Instant AI responses, 24×7 availability
Poor onboarding completion rates Weekly Medium (drop-off) $200–500 CAC wasted 30–60 min/process Email follow-ups Interactive guidance, live prompts
High support staffing costs Monthly N/A 20–40 % of budget — Hiring & training Automate 30 %+ of queries, reduce headcount needs
Inconsistent procedural advice Ad-hoc High (errors, anxiety) $100–1 000 penalty risk 15–30 min lookup Static knowledge bases Always-up-to-date AI with embedded SOPs
Our chatbot directly tackles the most severe, high-frequency “painkillers,” driving immediate ROI.
4. Geographic Market Analysis & Country Ranking
Country/Region 2023 Market Size CAGR Regulatory Fit Tech Adoption Competition Attractiveness
USA USD 1.293 B 23.3 % Mature, data-privacy Very High Medium ★★★★★
Canada USD 0.15 B (est.) ~22 % Single-payer ease High Low ★★★★☆
UK USD 0.25 B (est.) 22 % GDPR-aligned High Medium ★★★★☆
Germany USD 0.20 B (est.) 21 % Strict GDPR Medium-High Medium ★★★☆☆
Australia USD 0.10 B (est.) 20 % Privacy-friendly High Low ★★★☆☆
Singapore USD 0.05 B (est.) 25 % Pro-innovation Very High Low ★★★★☆
UAE USD 0.04 B (est.) 26 % Gov’t digital push High Low ★★★★☆
Brazil USD 0.08 B (est.) 24 % Emerging regulations Medium Low ★★★☆☆
India USD 0.07 B (est.) 28 % Evolving standards Medium-High Medium ★★★★☆
Japan USD 0.12 B (est.) 18 % Strict data rules High Medium ★★☆☆☆
Top 5: USA, Canada, UK, Singapore, UAE—balanced by market size, regulatory ease, tech readiness, and manageable competition.
5. Market-Sizing & Unit-Economics (Year 3)
Segment TAM SAM (20 %) SOM (20 % of SAM) Price CAC LTV LTV : CAC Payback
B2C (per user) USD 15 B (global) USD 3 B USD 600 M USD 5/user-month USD 50/user USD 300/user 6 : 1 3 months
B2B Providers USD 10 B USD 2 B USD 400 M USD 1 000/org-month USD 2 500/org USD 25 000/org 10 : 1 3 months
B2B Payors USD 8 B USD 1.6 B USD 320 M USD 0.50/member-month USD 10/member USD 120/member 12 : 1 1 month
Penetration Timeline:
Year 1: Pilot in USA & Canada (SOM ~ USD 68 M)
Year 2–3: Expand to UK, Singapore, UAE (add SOM ~ USD 70 M)
Year 4–5: Scale into Brazil, India, Australia (add SOM ~ USD 182 M)
Conclusion
With usage-based pricing, a robust, scalable tech stack (GPT-4/Llama 2, Kubernetes, FastAPI, Elasticsearch, Kafka, Spark, AWS Lambda), and demonstrable ROI across consumers, providers, and payors, our AI-Powered Chatbot is poised to capture a multi-billion-dollar opportunity. Targeting digitally advanced and high-growth markets in tandem, and focusing first on the USA, Canada, UK, Singapore, and UAE, will deliver rapid adoption, strong unit economics (LTV : CAC ≥ 6 : 1), and a clear path to market leadership in the global USD 27.3 billion chatbot market by 2030.